Trading is all about the odds. Trade when the odds are in your favor. Exercise patience and stand aside when the odds are NOT in your favor. Stocks are in a bear market with the vast majority of names (76%) trading below their 200-day SMAs. Clearly, the odds are NOT in our favor for equities and equity ETFs. Traders need to look elsewhere. Today’s report will highlight some non-equity leaders and analyze Bitcoin as it sets up.
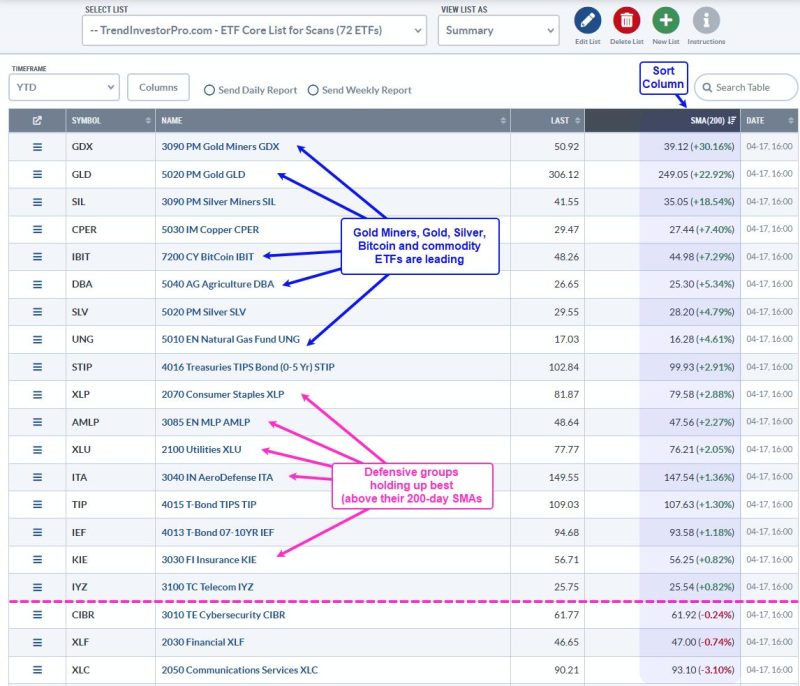
TrendInvestorPro works with a ChartList that has 72 ETFs covering all sectors, the key industry groups, commodities, bonds and crypto. Note that this curated ChartList is available to TrendInvestorPro subscribers. The image below is sorted by the percentage above the 200-day SMA (blue shading) to show the top 20 performers. This simple performance overview reveals a lot. We are NOT in a bull market and alternative assets are attracting attention (gold, Bitcoin).
First, we see leadership from gold, silver, Bitcoin, and commodity-related ETFs. Second, only a handful of equity ETFs are trading above their 200-day SMAs. Third, these ETFs represent defensive groups (Consumer Staples Utilities, MLPs, Aerospace & Defense, Insurance). This is NOT the performance profile for a bull market. We are in a bear market and equities are not the place to be right now.

Improve your odds and stay on the right side of the market with the models and analysis at TrendInvestorPro. Our stock market model turned bearish in mid March, and remains bearish. Even with the big surge on April 9th, our thrust indicators fell well short of a signal because of weak follow through. We will continue to watch these models and focus on equity alternatives. Click here to get a bonus and learn more!
The Bitcoin ETF (IBIT) is in the leadership group and Bitcoin ($BTCUSD) is bouncing off its 270 day SMA. Where did 270 come from? A typical 200-day SMA covers a little less than 9 months of trading days, which exclude weekends and holidays. Bitcoin trades 24/7, weekends and holidays. Chartists, therefore, need an adjustment to get the ~9-month equivalent for Bitcoin. I chose 270.
The chart below shows Bitcoin ($BTCUSD) with a classic correction and setup in the making. Bitcoin gained over 100% from September to January and was entitled to a correction. Dow Theory teaches us that normal corrections retrace 33 to 67 percent of the prior advance. 50 percent is the base case. The chart shows the Fibonacci retracements with Bitcoin retracing 61.8% as it fell to 75000. Bitcoin also tested the rising 270-day SMA in March and April. A 61.8% retracement and return to the ~9-month SMA are normal for corrections (blue shading).
A falling wedge formed with Bitcoin establishing resistance at 88000 (pink line). Falling wedge patterns are also typical for corrections. More importantly, these patterns provide levels to watch for a trend reversal. Bitcoin is making its first breakout attempt with a move above the upper trendline. Further strength above 88000 would forge a higher high and argue for a new uptrend. I would then set a re-evaluation level at the 270-day SMA. A close below this moving average would suggest a failed breakout.
TrendInvestorPro keeps you on the right side.
//////////////////////////////////////////////////